What is Relative Strength Index (RSI)?
The Relative Strength Index (RSI) is a momentum oscillator widely used in technical analysis to assess the speed and change of price movements in a financial instrument and developed by J. Welles Wilder.
RSI is a versatile indicator that helps traders identify overbought and oversold conditions in the market, signalling potential trend reversals.
RSI is expressed as a numerical value ranging between 0 and 100, with levels above 70 indicating overbought conditions and below 30 suggesting oversold conditions.
The formula of the Relative Strenght Index
The Relative Strength Index (RSI) is calculated using the following formula:
RSI=100−(100/1+R)
Where:
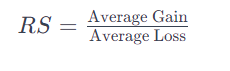
RS (Relative Strength) is the average of n days’ up closes divided by the average of n days’ down closes.
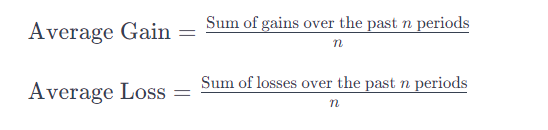
The average gain and average loss over n periods are calculated separately:
The Relative Strength (RS) is then calculated as the ratio of the average gain to the average loss:
The typical default value for n is 14, but traders may adjust this parameter based on their preferences and the characteristics of the market being analyzed.
How To USE Relative Strenght Index in FX Trading
Using the Relative Strength Index (RSI) effectively involves incorporating its signals into your overall trading strategy.
Finding Sell Opportunities
When the RSI crosses above 70, it indicates that the asset may be overbought, signalling a potential reversal or correction. Traders might interpret this as an opportunity to sell or take profits.
Finding Buy Opportunities
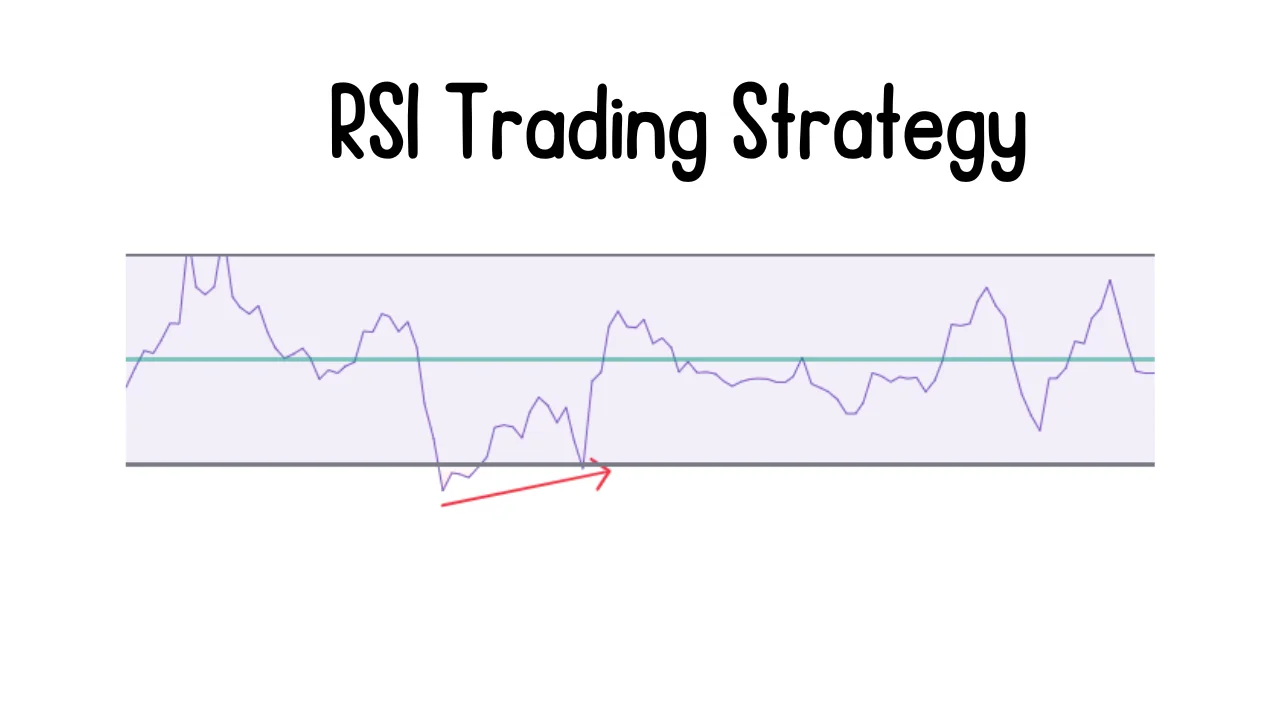
Conversely, when the RSI falls below 30, it suggests the asset may be oversold, signalling a potential upward reversal. Traders might consider buying or entering long positions in response.
Over Bought and Over Sold
Overbought in trading happens when the price of something, like a currency or an asset, goes way beyond certain levels, usually 70 or 80 on the RSI chart. It’s like a signal telling us that the thing is being traded at a much higher price than it’s worth. This is a heads-up for traders to consider selling because the price might drop soon.
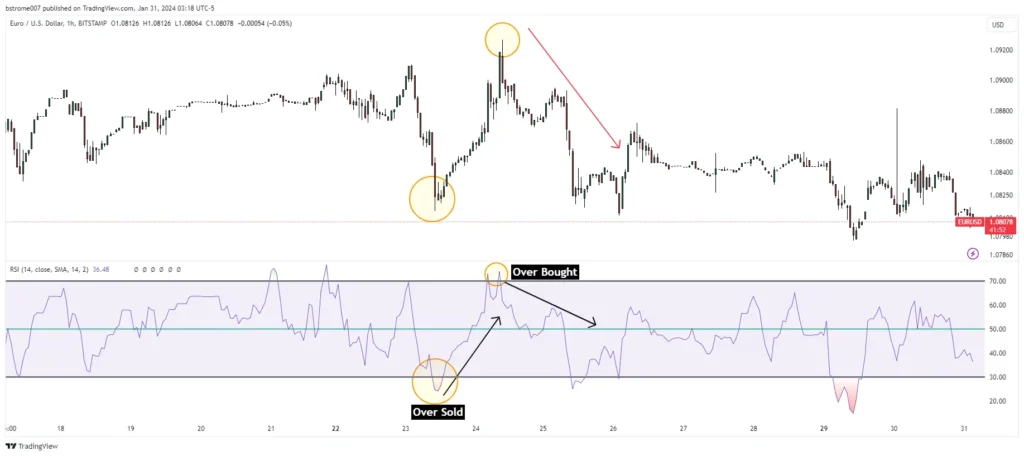
On the other side, Oversold is when the price of something drops below levels like 30 or even 20 on the RSI chart. This suggests that the currency or asset is being traded at a lower price than its actual value. In this situation, it’s like a signal for traders to think about buying because the price might go up soon.
Traders often use these numbers (70,30 and 20,80) along with Divergence for better success in making decisions.
Divergence in Trading
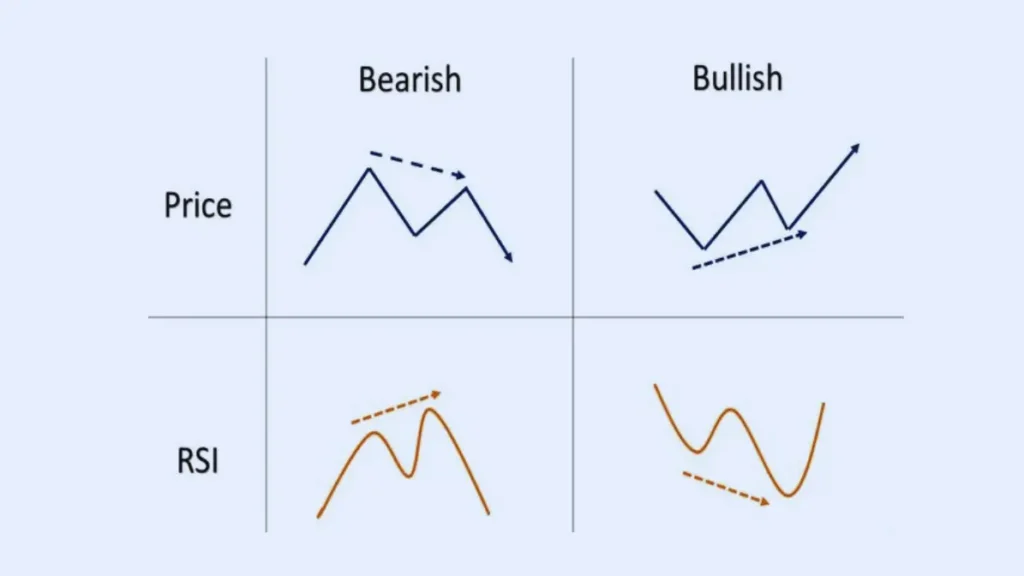
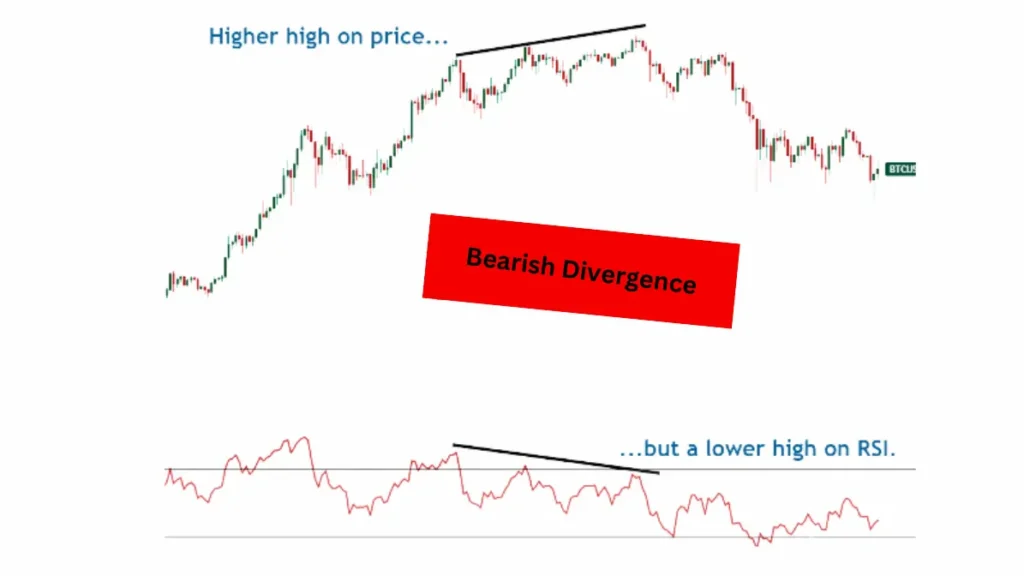
In trading, “divergence” refers to a situation where the price of an asset and a technical indicator move in opposite directions. It is often used by traders as a potential signal of a trend reversal or a weakening trend.
There are two main types of divergence: regular or classic divergence and hidden divergence
Regular (Classic) Divergence:
Bullish Divergence: This occurs when the price of an asset forms lower lows, but the corresponding indicator (usually an oscillator like the Relative Strength Index – RSI or the Moving Average Convergence Divergence – MACD) forms higher lows.
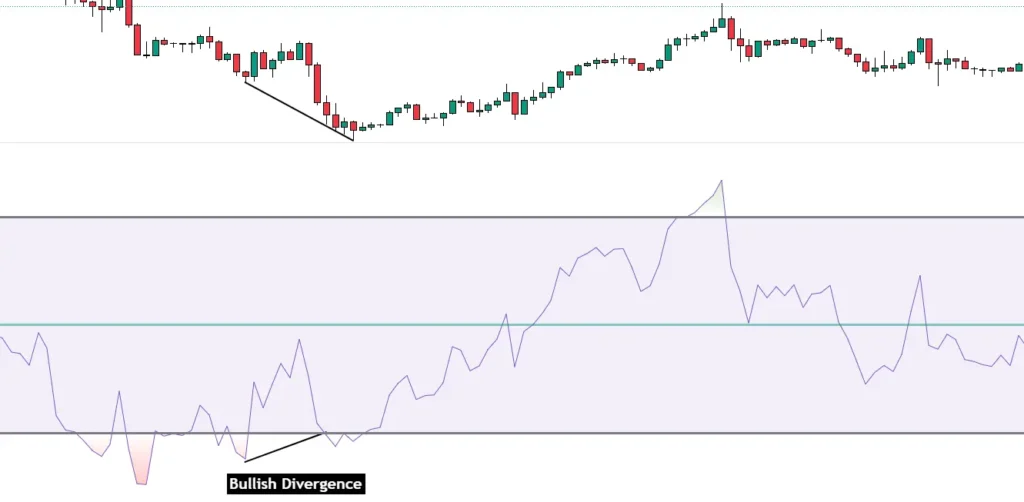
It suggests that while the price is still moving lower, the momentum behind the move is weakening, and a potential upward reversal might be on the horizon. Traders might interpret this as a signal to go long or exit short positions.
Bearish Divergence: This occurs when the price of an asset forms higher highs, but the indicator forms lower highs. It indicates that the upward momentum is slowing down, and a potential downward reversal might be imminent. Traders might interpret this as a signal to go short or exit long positions.
Hidden Divergence:
Bullish Hidden Divergence: This occurs when the price forms higher lows, but the indicator forms lower lows. It suggests that even though the price is experiencing a pullback, the underlying bullish trend is still strong, and the price is likely to continue upward. Traders might interpret this as a signal to go long or add to existing long positions.
Bearish Hidden Divergence: This occurs when the price forms lower highs, but the indicator forms higher highs. It indicates that despite the price making higher highs, the underlying bearish trend is still in place, and the price is likely to continue downward. Traders might interpret this as a signal to go short or add to existing short positions.
RSI Indicator Setting
Setting and adjusting the Relative Strength Index (RSI) indicator involves choosing the right parameters for the indicator to match the trader’s preferences and the characteristics of the financial instrument being analyzed.
The default setting for RSI is often a period of 14, but traders can adjust this based on their trading strategy and time frame. Here are steps to set and adjust the RSI indicator:
- Shorter periods, like 7 or 9, may provide more sensitive readings, reacting quickly to price changes. Longer periods, like 21 or 25, may provide smoother readings, filtering out short-term fluctuations.
- Traders may adjust the period based on the trading style and the time frame of their analysis.
RSI and MACD Trading Strategy
The MACD+RSI trading strategy combines two popular indicators, the Moving Average Convergence Divergence (MACD) and the Relative Strength Index (RSI), to make trading decisions.
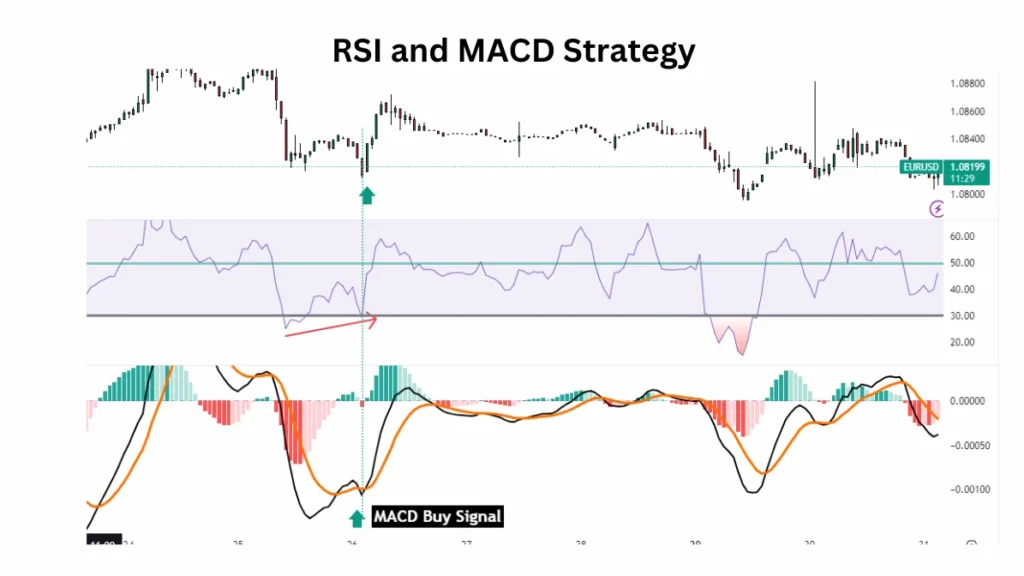
Buy Signal:
- MACD Bullish Crossover: Look for a moment when the MACD line (the faster one) crosses above the Signal line (the slower one). This is a bullish signal indicating potential upward momentum.
- RSI Confirmation: Check the RSI. If the RSI is below 70 (not in overbought territory) and is showing strength (above 50), it confirms the buy signal.
Sell Signal:
- MACD Bearish Crossover: Look for a moment when the MACD line crosses below the Signal line. This is a bearish signal indicating potential downward momentum.
- RSI Confirmation: Check the RSI. If the RSI is above 30 (not in oversold territory) and is showing weakness (below 50), it confirms the sell signal.
Difference Between RSI and MACD
| Aspect | RSI (Relative Strength Index) | MACD (Moving Average Convergence Divergence) |
|---|---|---|
| Calculation Basis | Compares average gains and losses directly. | Measures the difference between two moving averages. |
| Calculation Method | Analyzes recent price changes for overbought/oversold conditions. | Uses the difference between two exponential moving averages (typically 12-day and 26-day) with a signal line. |
| Scaling | Scaled between 0 and 100. | No specific scale; values can be positive or negative. |
| Signals | Overbought (above 70) and oversold (below 30) levels indicate potential reversals. | Crossovers between the MACD line and the Signal line suggest potential changes in momentum. |
| Focus | Emphasizes the relative strength of upward and downward price movements. | Emphasizes the convergence or divergence of moving averages. |
| Indicator Type | Momentum oscillator. | Trend-following momentum indicator. |
This table provides a concise overview of the key differences between RSI and MACD. Each indicator has its unique approach to analyzing market dynamics and providing signals to traders.
What Happens When RSI Is High?
When the Relative Strength Index (RSI) is high, typically with a reading above 70, it suggests that a security or asset may be in an overbought condition.
An RSI reading above 70 indicates that the price has experienced a strong upward movement, and traders interpret this as a signal that the asset may be due for a potential reversal or correction.
- Overbought Signal:
- An RSI reading above 70 is generally considered to signal that the market is overbought. This means that the price may have risen too quickly or too much in a short period.
- Traders view this as a cautionary signal, suggesting that the upward momentum may be unsustainable in the short term.
- Potential Reversal:
- A high RSI reading implies that the security is likely overvalued, and there could be a higher probability of a downward correction or reversal shortly.
- Traders may interpret this as a potential opportunity to sell or take profits before a possible decline in price.
- Consideration for Selling:
- Traders often consider selling or reducing their positions when the RSI is high, anticipating a pullback in the price.
- It’s important to note that while a high RSI suggests a potential reversal, it doesn’t provide timing information. The price could remain high for an extended period before a correction occurs.